The equality ranking by India using consumption Gini does not capture wealth distribution, social disparity and data imperfection- that are why multi-dimensional measurement of inequality is needed.
Indian government claimed to be the 4thmost equal country in the world by the basis of World Bank brief according to consumption-based Gini Index. Although this indicator implies that the low-level inequality is comparatively low in comparison with other countries, it provides only a partial view of the reality. When based on consumption, the Gini coefficient has a tendency of concealing inequality in wealth and income and opportunities. When a small number of billionaires own a large proportion of the national wealth, there is a danger that the consumption survey-based measures alone will underreport the top-end inequality and social exclusions in a country.This articlereads the issues with the consumption-based measures that fail to reflect on the full scope of inequality in India. It addresses the way in which such diverse issues as wealth distribution, caste and gender disparities, regional inequalities, and the provision of basic services such as health and education get lost in the same narrow focus. Decoding the shortcomings of the World Bank brief, this article argues why there is a need to aim beyond the consumption Gini as a standalone indicator of inequality to more multidimensional indicators. The idea is not to reject the consumption Gini, but to put it in perspective in the sprawling Indian socio-economic context which requires a more holistic and participatory way to knowledge and gesturing towards the inequality.
Interpretation of Gini Index
Gini Index is a statistic measure index to measure inequality in the distribution of a resource of any kind most widely known is income or consumption among a given population.
- It varies between 0 and 1 with 0 (all people have the same income or consumption) and 1 (one person has all the resources and the other none).
- The consumption based Gini Index has been commonly used in the Indian context as the coverage of the income and wealth data has been limited.
- This measure calculates inequality according to the spending behaviour of the household in the assumption that expenditure indicates well-being over the long-term economic aspect.
- The consumption may however be spread in the course of time especially by the poorer households exposed to economic shocks via borrowing, collective support, or subsistence. This implies that real deprivation can be concealed behind fixed appearance of activities in consumption.
- Additional measures of Gini, income based or wealth-based, however, reflect different shades of disparity at the uppermost strata.
- An example of this is the wealth inequality, which regards the possession of assets and capital gains, areas that have sharp concentration in India.
- Preference to consumption data is usually due to the superior coverage of the survey and reduced sensitivity of respondents, but they potentially overshadow the truth about social exclusion and structural inequality.
To have a fuller idea about economic inequality, a Gini Index has to be used with othercomplementary statistics and in a contextual understanding.
The World Bank Short & Government Arguments
During early 2024 World Bank brief stirred considerable interest in ranking India fifth most equal nation worldwide by its consumption-based Gini Index. A report with data of household consumption in many countries ranked India at the fourth most unequal country, and eager policymakers jumped out to make buzzing claims.
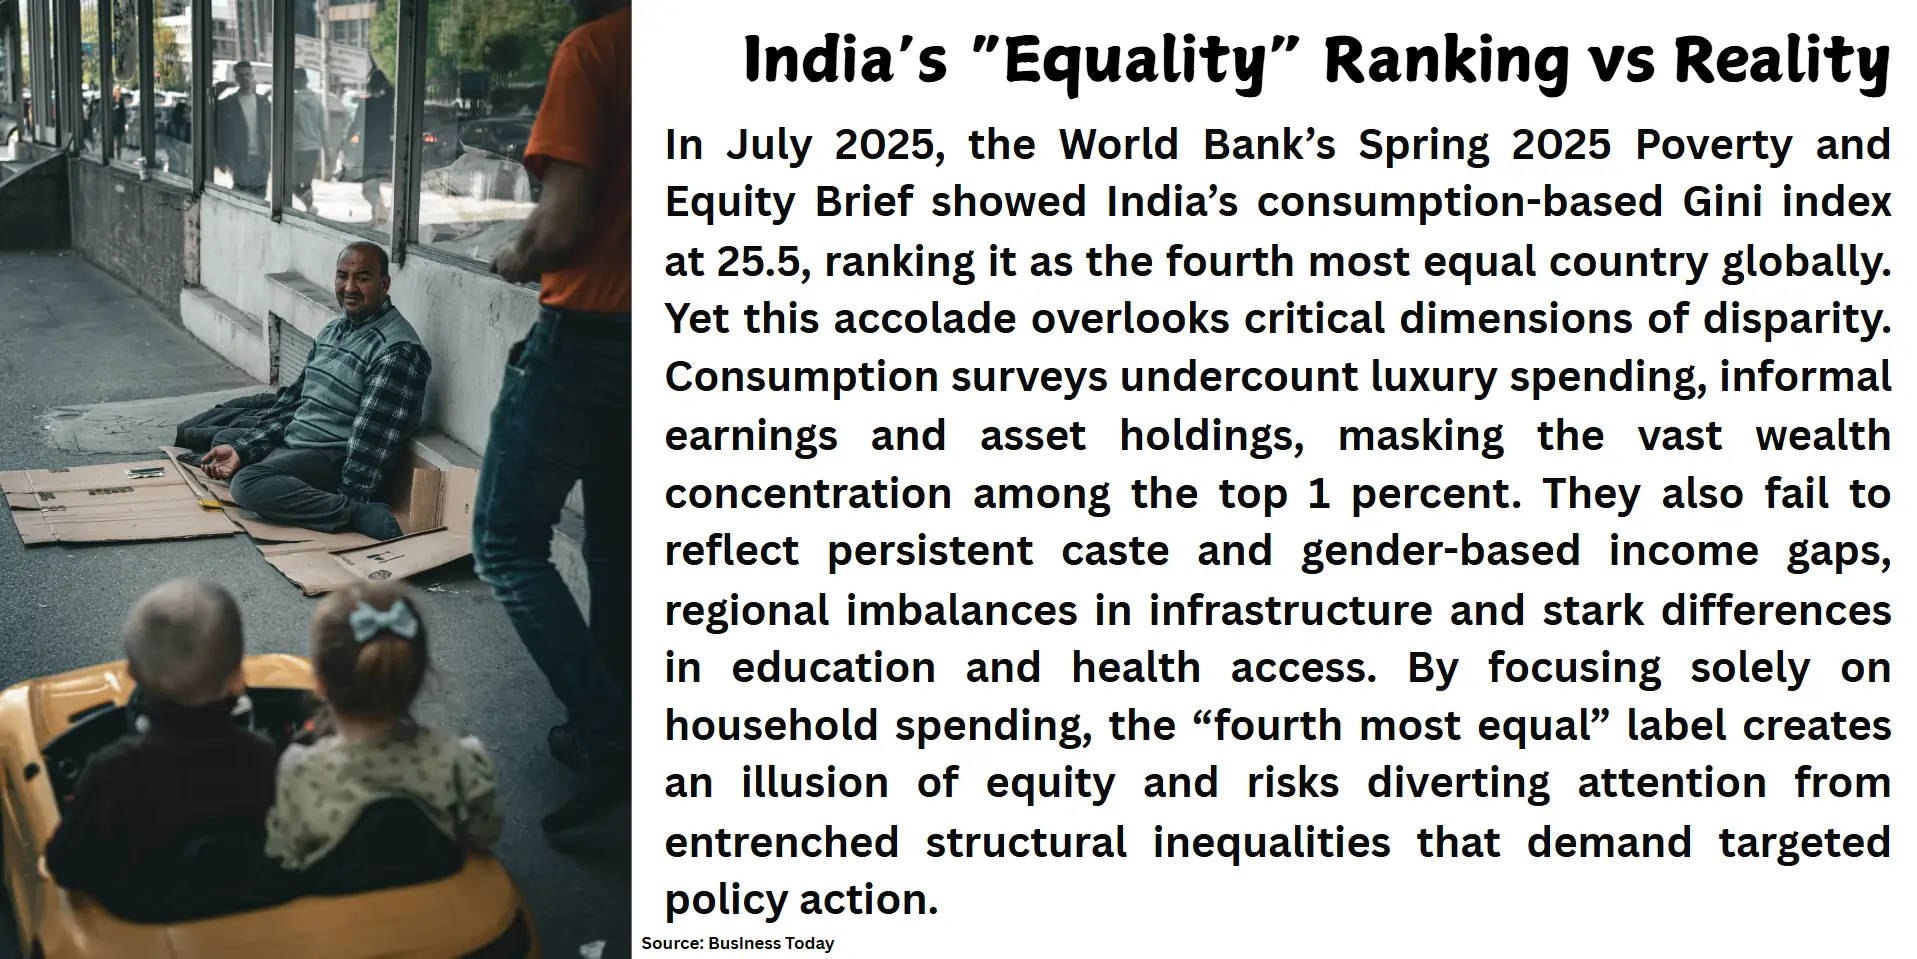
- The government has used this discovery as a justification of its welfare-driven reformations and inclusive growth measures and are pointing to smaller consumption gaps between households to prove that it is working on reducing these economic inequalities.
- This characterization has however brought about serious questions with respect to the methodology involved. The survey-based consumption data which is basically used by the brief usually lacks data on income and wealth particularly at the highest levels of the society.
- It also summarizes the data without considering the structural differences based on caste, gender, region, and access to the public services. Although the genus of the reported consumption inequality decreases is of interest, it does not automatically symbolize any decrease in economic inclination therein or changes to the level of economic fairness.
- The policy analysts and academic voices warn that consumption equality should not be defined as general socio-economic equality. Although the findings of the World Bank are based on available data, they provide a rather limited scope through which individuals can interpret the analysis of inequality, as one has to be guided by broader measures in order to obtain a more realistic and valuable analysis.
What This Conclusion Leaves Out
Highlighting consumption data as a basis to assert that India is one of the most equal countries in the world, understates sophisticated aspects of inequality.
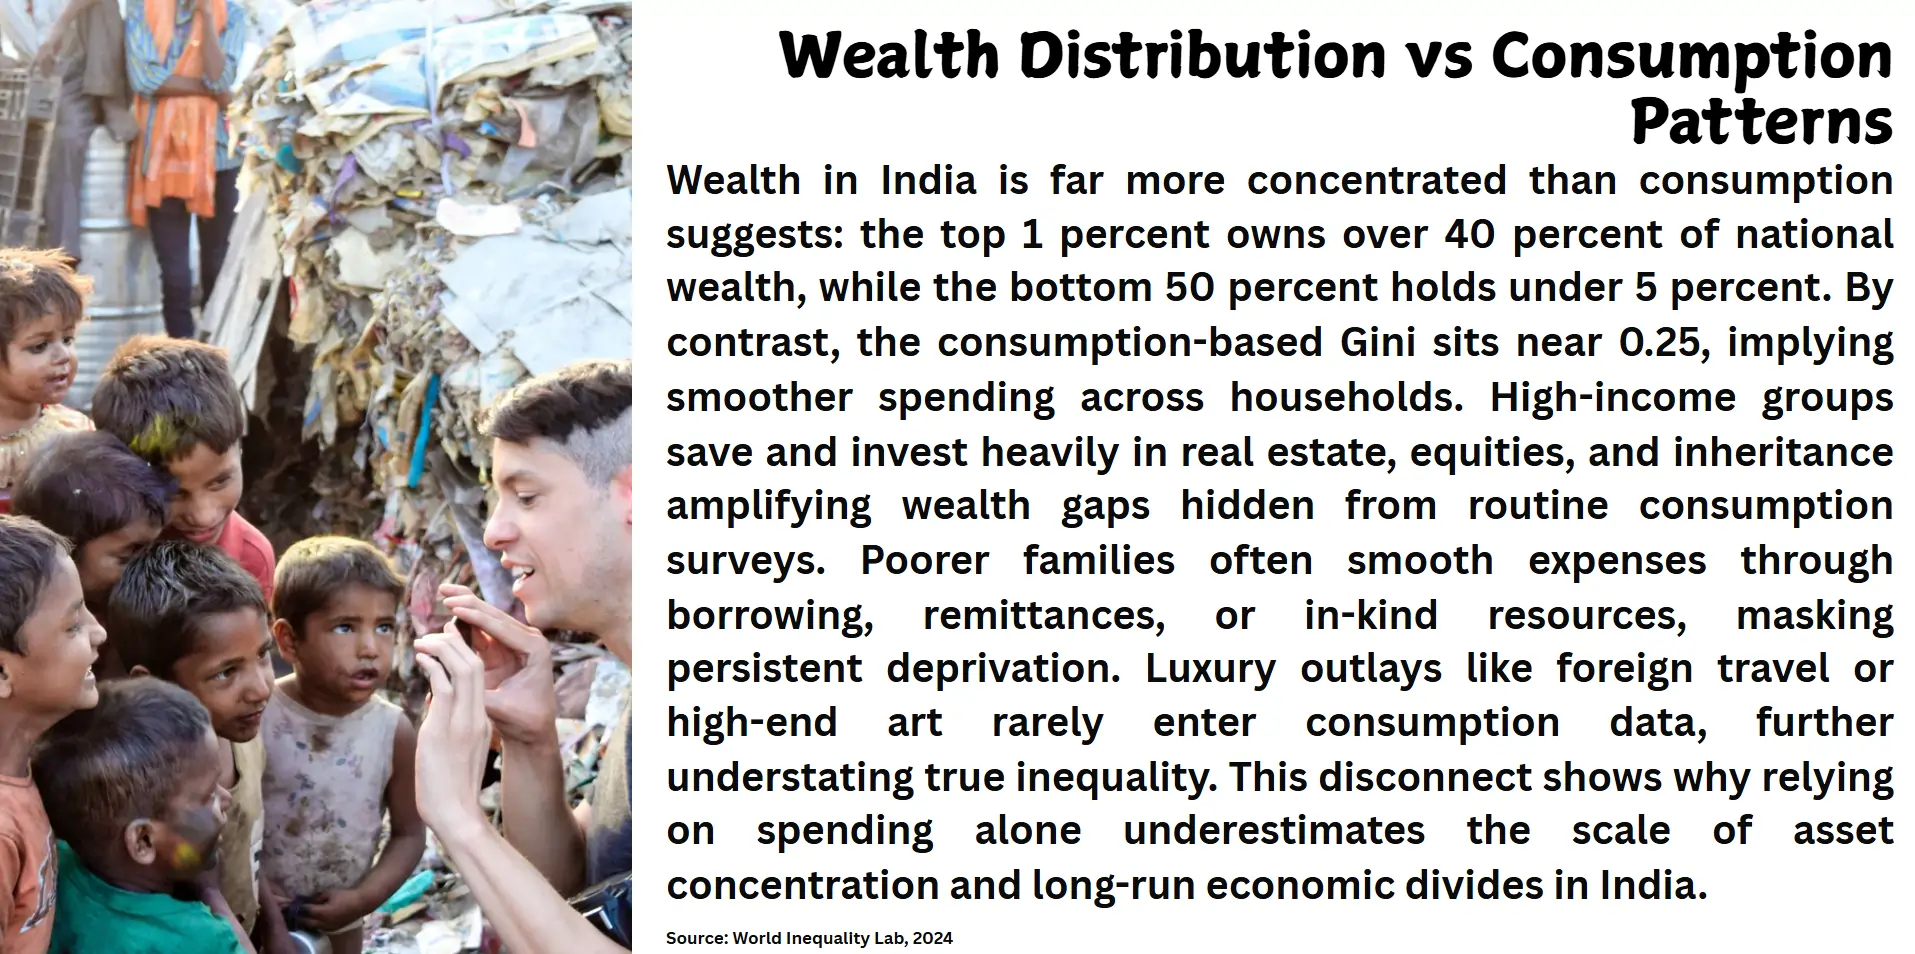
Wealth accumulation Above Consumption
Billionaires in India hold an inordinate amount of wealth even in the country but their economic presence is not tracked in survey data of consumption. Contrary to income or asset statistics, the consumption trends of the super-rich are not well-measured, usually because it is under-reported or because it is not included in a sample frame. As a result, inequality in the distribution of wealth, which is driven by property, stocks and corporate holdings, is swept under the carpet, where an unbalanced picture of general parity is depicted.
Unpredictable Income and the Hidden Frailties
Consumption-based indicators presume the steady access to resources, paying no attention to the variability that is typical of incomes of a huge majority of Indians. Populations with high daily wage earnings and informal workers as well as small farmers normally have frequent financial shocks like cropfailures, health emergencies or loss of a jobwhich do not always result in a corresponding reduction in consumption because of borrowing or social safety nets. The disconnect masks finer economic insecurity.
Social Inequalities in Multi-dimensions
It is not possible to see economic equality without the social indicators. Education, healthcare services and sanitation across caste, gender and geographical distinctions have extremely varied accessibility to quality services. The future of a child is closely connected to the social identification, and the underrepresented groups are exposed to systematic challenges that cannot be highlighted through data in consumption. Even the households spending similarly demonstrate such inequalities.
Caste, gender and regional imbalances
Gini Index does not take into consideration deep-rooted socio-cultural stratifications. As an example, Dalit and Adivasi people are still alienated regarding formal jobs and land ownership. Even though women both contribute to household finance and unpaid labor, they are not represented in workforce figures well. And so, too the rural compared with the urban lag behind even if consumption per head may have been similar.
Data Limitations and Bias of Survey
Consumer surveys used when the sample size islarge are usually prone to methodologicallimitations as well as sampling bias. Higher income households can decline or underreport and seasonality of income is seldom adjustable. In addition, consumption at the top echelon like the use of private jets, purchase of art or foreign expenditure is out of the picture. This restricts the effectiveness of inequality evaluation and reduces the extent of the situation in the society.
Policymakers act perilously when they become too narrow by focusing on consumption-based indicators and ignore inequalities as a multi-faceted, persistent and intersecting phenomenon that shapes the socio-economic reality in India. A more integrated measure is required to develop the real inclusiveness involving earnings, affluence, facility, and opportunity.
Pitfalls of consumption-based Gini
Consumption-Based Gini Index presents a delimited view of economic inequality and when used in isolation, it does not gauge structural inequalities. The following is an analysis of the highlights of the failures of solely using this measure:
Limited Scope and wealth visibility
The surveys of consumption do not include the possession of assets, income on investments, capital gain, and the main ingredients of wealth inequality. Comparable spending households can extensively differ in the financial security, but such a detail is lost amid consumption-based measurements. Policies that are made as a result of these data can therefore miss the increasing concentration of assets.
Covering up the Economic Volatility
The consumption data tends to smooth out the expenses of the income, particularly, of vulnerable groups. Families suffering with unemployment or loss of seasonal income normally manage their expenditure by borrowing or even informal assistance. This causes a perception of economic equilibrium and hides a shadow of financial weakness.
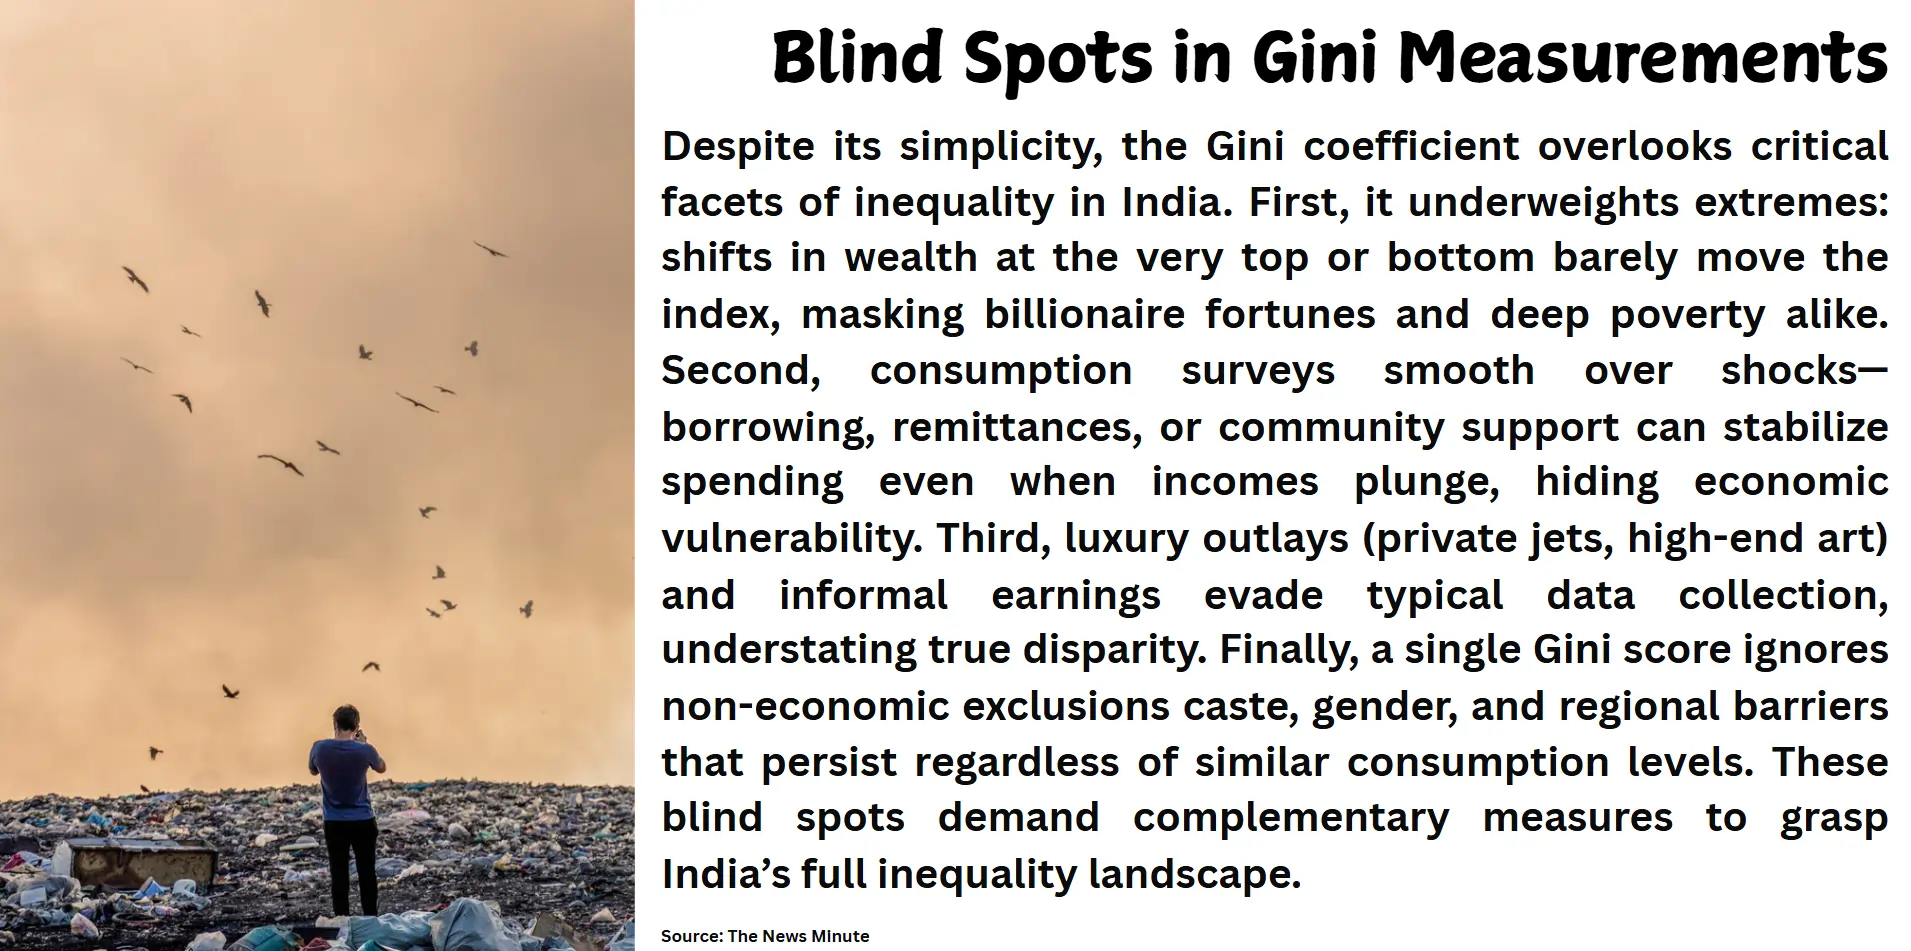
Data Collection and Underreporting
The surveys that are used in determining consumption Gini are usually perhaps biased in favour of the poor households or underrepresenting the rich household thus avoiding surveys or understating their expenditure. Top-of-the-line consumption models, as in foreign travel, luxury goods or property, are often not considered in datasets and hence distort the interpretation and will lowball real inequality.
Structural and Social Exclusions
Gini Index fails to take into consideration the non-economic aspects of life like access to quality education, health and physical infrastructure. The minority groups might spend equally as others but they are still disadvantaged. Failing to consider these factors reduces the versatility of the metric when constructing development policies that are inclusive.
Oversimplification of Inequality
The consumption Gini can create a false impression by simplifying the assessments of complex and multi-layered inequities down to one number. It fails to measure intergenerational poverty, regional disparity, and discrimination that may exist and are pertinent in trying to understand the larger picture of inequality in India.
The Broader Measures & Alternative Approaches
To be able to reveal the entire circle of inequality in India, analysts should rather spread the nets of investigation wider and more multidimensional in their frames of assessment. These alternatives will provide clearer views of inequity in wealth, opportunity and access.
Metrics Using Wealth and Income
Results of asset concentration are exposed by the Wealth Gini Index, as it shows a better representation compared to the consumption information; it shows the extent of economic cavities among the wealthiest one percent. On the same note, income-based measurements, which would constitute tax records and administrative statistics, would reveal gaps in earnings that surveys are not likely to capture, particularly in informal economies.
Palma and Atkinson ratios
Equally notable are Palma ratio which compares the income share of the top 10 percent to that of bottom 40 percent with the idea of underscoring accumulation among the elites against broad based deprivation. The Atkinson index applies to the dislike of inequality in society, placing more importance on the difference in income at the bottom end to this extent; it is a useful instrument in equitable policymaking.
Multidimensional Indices of Poverty and Capability
The Multidimensional Poverty Index (MPI) depicts deeper poverty that cannot be portrayed by money alone because of underlying lacks in other non-monetary areas, such as education, health, and standards of living.Capabilities approach advocated by Amartya Sen underlines freedoms and opportunities that are frequently overlooked by fiscal measures since the approach focuses on what people can actually do and be.
Recruiting Administrative and Big Data
Smart applications, such as digital payment pathways, satellite pictures, and geo-tagging service availability, may bring inequality monitoring to an even more fine-grained level. When paired with real-time dashboards and behavioural information, these procedures can provide real-time, contextualized information, allowing them to provide interventions that consider real-life experiences.
Policy Implications
The excessive attention given to consumption-based inequality measurement by India suggests the need to critically review policy instruments and approaches to their socioeconomic progression. The inequality cannot be understood only in a multidimensional manner because it involves more than an immediate welfare scheme which focuses on immediate consumption disparities, it involves structural changes towards equity and empowerment.
- Tax Reform: Assets at the top can be redistributed through progressive taxation. Sealing loopholes, increasing compliance, and reducing potential taxpayers can shift fiscal resources to the underserved without sagging growth.
- Expanding Social Safety:It is important to strengthen other schemes besides offering food and fuel subsidies. Resilience can be built through investments in universal health care, education and digital infrastructure, particularly in areas with high level of income volatility and exclusion in informal sectors.
- Data-Driven Governance:India requires more diverse, present-day information environments that integrate family surveys with administrative files and online sites. Tracking changes in inequality can be done with higher-frequency monitoring and can enable it to adapt to policymaking.
- Focusing on Minority Groups: There should be policies that openly manage differences arising out of caste, gender, and regions. Affirmative action interventions on employment, education, and access to credit ought to change to reflect the more distinct conditions disclosed by more diverse measures of inequality.
Conclusion
Just becoming the fourth most equal country on the basis of consumptionbased Ginidata gives a caveated and rather limited view of the situation of inequality in India. Although they provide revealing glimpses of household expenditures, such measures do not reflect structural deficienciespoverty, wealth concentration, income volatility, and cast, gender, and geographical exclusions. The false sense of equality coming out of smoothing the consumption figures is likely to cause policy complacency and will undermine making progress towards long-term, inclusive growth.It is imperative to have a stronger strategy by switching over to multidimensional types of indicators that address the opportunity, quality of life and economic security. The inclusion of wealth information, social determinants, and administrative data allow the policymakers to design more specific interventions that correspond to realize realities. Finally, inequality needs to be gauged not only by what individuals devour, but by what they possess, what they deprive and what they can transform into. And the new way of measuring disparity can be the major step towards fair India.