The World Economic Forum (WEF) has released the Global Gender Gap Report 2026, covering 145 economies. The report measures gender parity across four major dimensions and shows that while the world has made gradual progress, significant gaps remain, particularly in economic participation and political empowerment.
Why in the News?
The World Economic Forum (WEF) recently released the 2026 Global Gender Gap Report, the 20th edition of the report.
The report covers 145 economies and also analyses a longitudinal constant sample of 97 economies that have been included in every edition since 2006.
Global indices are important markers for understanding a country's comparative progress.
What is the Global Gender Gap Index?
The Global Gender Gap Index is released annually by the World Economic Forum (WEF). It was first introduced in 2006 to benchmark the current state and evolution of gender parity.
The Index measures gender parity across four major dimensions:
- Economic Participation and Opportunity
- Educational Attainment
- Health and Survival
- Political Empowerment
The index ranges between 0 and 1, where 1 represents complete parity. The gender gap represents the distance from full parity.
Global Gender Parity in 2026
According to the Global Gender Gap Index 2026, the world has closed 69.2% of the overall gender gap.
This represents a 0.4 percentage point improvement compared to the previous year. However, no economy has achieved complete gender parity.
Iceland Leads Global Rankings
For the 17th consecutive year, Iceland recorded the highest level of gender parity.
- Iceland: 93%
- It remains the only economy to have closed more than 90% of its overall gender gap.
- Finland: 87.2%
- Norway: 85.7%
Europe Dominates the Top Performers
European economies account for 70% of the leaderboard in 2026.
| Country | Gender Parity | Rank |
|---|
| Iceland | 93% | 1st |
| Finland | 87.2% | 2nd |
| Norway | 85.7% | 3rd |
| United Kingdom | 84.2% | 5th |
| Sweden | 82.3% | 7th |
| Germany | 81.7% | 9th |
| Ireland | 81.4% | 10th |
Other economies completing the top 10 include:
- Namibia: 84.5%, ranked 4th and the highest-scoring Sub-Saharan economy.
- New Zealand: 82.8%, ranked 6th.
- Australia: 81.9%, ranked 8th and making its top 10 debut.
Economies from Eastern Asia and the Pacific have the second-highest footprint among the top 10, accounting for 17% of the top 10.
Gender Gaps Across Different Dimensions
The four dimensions show considerable differences in the level of gender parity. Educational Attainment and Health and Survival are the two dimensions closest to parity. In contrast, the widest gaps remain in Economic Participation and Opportunity and Political Empowerment. This indicates that progress in basic human development outcomes has been considerably greater than progress in women's participation in economic and political decision-making.
| Dimension | Global Gender Parity |
|---|
| Educational Attainment | 96.9% |
| Health and Survival | 96.2% |
| Economic Participation and Opportunity | 61.7% |
| Political Empowerment | 22.1% |
Educational Attainment and Health and Survival are the two dimensions closest to parity. In contrast, the widest gaps remain in Economic Participation and Opportunity and Political Empowerment. This indicates that progress in basic human development outcomes has been considerably greater than progress in women's participation in economic and political decision-making.
Watch : Global gender gap index 2026
Countries at the Bottom
- Chad ranked lowest, at 145th position.
- It was joined in the bottom three by Pakistan and Iran.
What Is India's Rank?
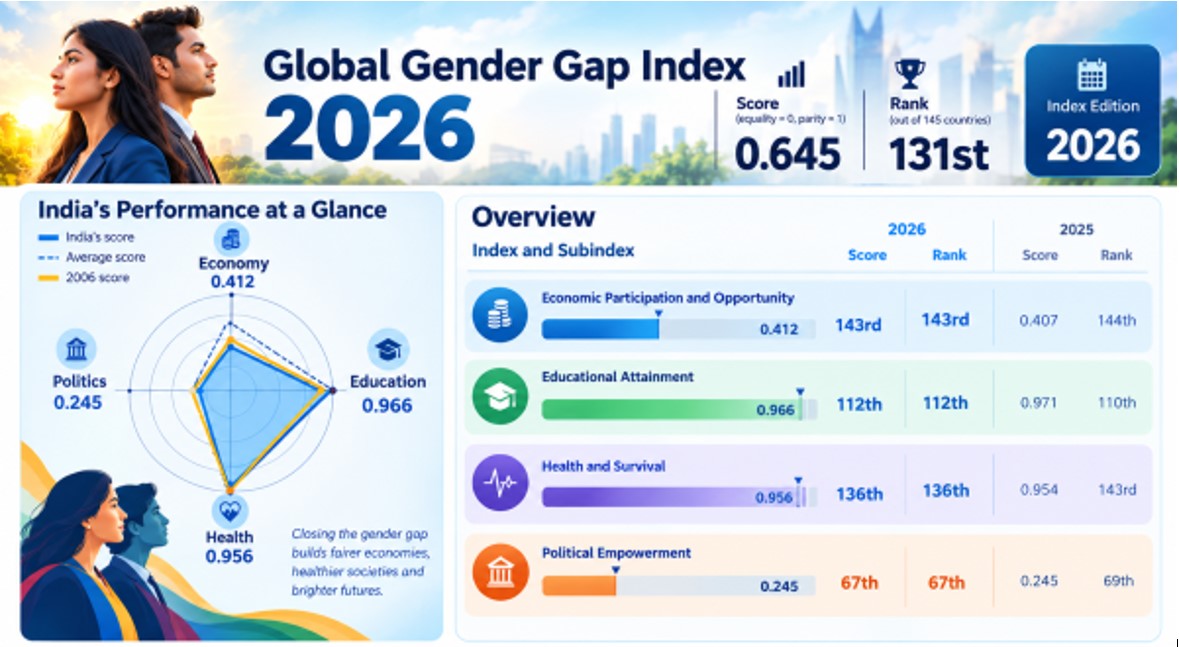
- India has retained its 131st rank out of 145 economies in the 2026 index.
- India recorded 64.5% gender parity.
- The country has improved by 4.3 percentage points since the inaugural 2006 edition. However, India's score remains below the global average of 69.2%.
India at a Glance
| Indicator | India |
|---|
| Rank | 131st out of 145 |
| Gender parity | 64.5% |
| Improvement since 2006 | 4.3 percentage points |
| Global average | 69.2% |
Beyond the Nugget: Important Gender-Related Indices
Apart from the Global Gender Gap Index, several other indices are used to understand gender inequality and women's empowerment.
1. Gender Inequality Index (GII)
The Gender Inequality Index (GII) is published by the United Nations Development Programme (UNDP) through its Human Development Report.
It measures gender inequalities across three key dimensions:
- Reproductive health
- Empowerment
- Labour market
The score ranges from 0 to 1:
- 0: Women and men fare equally.
- 1: One gender fares as poorly as possible across all measured dimensions.
2. Gender Development Index (GDI)
The Gender Development Index (GDI) is published by the UNDP.
It measures gender inequalities in achievement across three basic dimensions of human development:
- Health
- Education
- Command over economic resources
The economic dimension is measured through estimated female and male earned income.
3. Global Gender Parity Index (GGPI)
The Global Gender Parity Index (GGPI) is a composite scheme developed by the UNDP and UN Women. It assesses the status of women's achievements relative to men's across four dimensions:
- Life and good health
- Education, skill-building and knowledge
- Global Gender Gap in Unpaid Labor and financial inclusion
- Participation in decision-making
4. Women's Empowerment Index (WEI)
The Women's Empowerment Index (WEI) is a composite index developed by the UNDP and UN Women.
It measures women's empowerment across five dimensions:
- Health
- Education
- Inclusion
- Decision-making
- Violence against women
A value closer to 1 indicates higher empowerment across the five dimensions, while a value closer to 0 indicates lower empowerment.
Conclusion
The Global Gender Gap Index 2026 shows that global gender parity has improved gradually, with 69.2% of the overall gap closed. However, the progress remains uneven across different dimensions. Education and health are much closer to parity, while economic participation and political empowerment continue to show much wider gaps. India, with 64.5% gender parity and a rank of 131st, has improved since 2006 but remains below the global average.
Test your understanding
Questions from this article
Prelims practiceQuestion: With reference to Global gender gap index 2026: India ranks 131st among 145 countries, consider the following statements:
- The World Economic Forum (WEF) has released the Global Gender Gap Report 2026, covering 145 economies
- The report measures gender parity across four major dimensions and shows that while the world has made gradual progress, significant gaps remain, particularly in economic participation and.
Which of the statements given above is/are correct?
- 1 only
- 2 only
- Both 1 and 2
- Neither 1 nor 2
View answer and explanation
Suggested answer: (c) Both 1 and 2
Explanation: Global Gender Gap Index 2026. India ranks 131st among 145 countries, with 64.5% of its gender gap closed. Explore India’s performance across economic participation, educational attainment, health and survival, and political empowerment, along with key gender parity trends
Mains practiceQuestion: Discuss Global gender gap index 2026: India ranks 131st among 145 countries with reference to Why in the News?, What is the Global Gender Gap Index?, Global Gender Parity in 2026 and Iceland Leads Global Rankings. (150 words, 10 marks)
View answer-writing approach
Answer approach:
- Introduce the topic using its meaning and context.
- Explain Why in the News?, What is the Global Gender Gap Index?, Global Gender Parity in 2026 and Iceland Leads Global Rankings.
- Use facts and examples given in the article.
- Conclude with a balanced way forward.
Frequently asked questionsFrequently asked questions
What is Global gender gap index 2026: India ranks 131st among 145 countries?
Global Gender Gap Index 2026. India ranks 131st among 145 countries, with 64.5% of its gender gap closed. Explore India’s performance across economic participation, educational attainment, health and survival, and political empowerment, along with key gender parity trends
Why is Global gender gap index 2026: India ranks 131st among 145 countries relevant for UPSC preparation?
The report measures gender parity across four major dimensions and shows that while the world has made gradual progress, significant gaps remain, particularly in economic participation and political empowerment
What key points should aspirants remember about Global gender gap index 2026: India ranks 131st among 145 countries?
The article covers Why in the News?, What is the Global Gender Gap Index?, Global Gender Parity in 2026 and Iceland Leads Global Rankings.