UPSC Current Affairs
WORLD INEQUALITY REPORT
The World Inequality Report 2026 has been released. It shows that income and wealth inequality in India are among the highest in the world. Key finding: Top 10% earn 58% of India’s income; bottom 50% earn only 15%.
VRAuthor Desk
3 min read
The World Inequality Report 2026 has been released. It shows that income and wealth inequality in India are among the highest in the world. Key finding: Top 10% earn 58% of India’s income; bottom 50% earn only 15%.
WHY IN NEWS?
- The World Inequality Report 2026 has been released.
- It shows that income and wealth inequality in India are among the highest in the world.
- Key finding: Top 10% earn 58% of India’s income; bottom 50% earn only 15%.
WHAT THE REPORT SAYS ABOUT INDIA?
Income Inequality
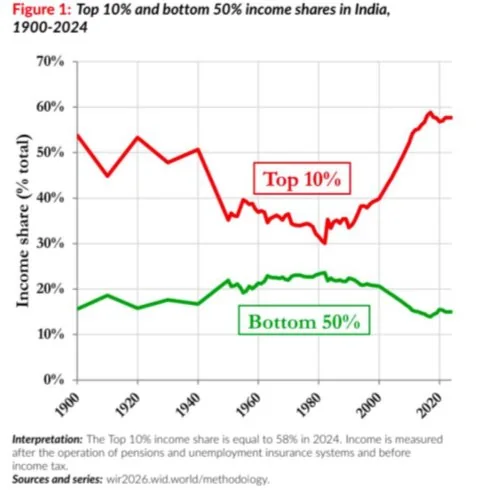
- Top 10% earners ₹ 58% of national income
- Bottom 50% ? only 15%
- Earlier Report 2022: top 10% had 57%, bottom 50% had 13%. ? inequality is not improving much.
 Wealth Inequality (even worse)
- Top 10% hold 65% of total wealth
- Top 1% hold around 40% of all wealth
- Bottom 50% hold only tiny share.
Average Income & Wealth (PPP terms)
- Average income per person: 6,200 euros
- Average wealth per person: 28,000 euros
Gender Inequality
- Female labour participation: 15.7% — almost no improvement in last decade.
- Women earn:
- 61% of men's income per working hour (excluding unpaid work)
- 32% when unpaid household work is included
- Women’s share in labour income:
- South & Southeast Asia ? 20%
- MENA (Middle East & North Africa) ? 16%
- Europe/North America ? around 40%
GLOBAL TRENDS
Extreme Global Wealth Concentration
- Top 0.001% (about 60,000 rich people globally) own 3× more wealth than the bottom 50% of humanity.
- Global top 10% own 75% of all wealth.
- Global bottom 50% own only 2%.
- Top 1% alone hold 37% of world wealth.
Ultra-rich Inequality
- Top 0.001% average wealth ? ~1 billion euros
- Top 1 in 100 million (56 people worldwide) ? 53 billion euros each
This shows inequality exists
not only between rich and poor, but also
within the rich.
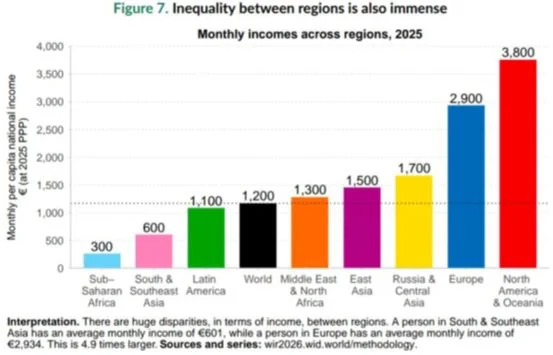
INDIA’S POSITION IN GLOBAL INCOME DISTRIBUTION
- 1980 vs 2025 Comparison
- 1980:
- India was mostly in the bottom half of global income ranks.
- China was also at the bottom.
- 2025:
-
- China moved upward ? large population entered global middle class.
- India slipped backward ? most people now in bottom 50%
- Sub-Saharan Africa also remains in lowest brackets.
CLIMATE INEQUALITY
- Bottom 50% of world ? only 3% of emissions from private capital.
- Top 10% ? 77% of emissions.
- Top 1% ? 41% of emissions alone.
- This shows climate crisis is driven mainly by the rich, not the poor.
WHY INEQUALITY PERSISTS?
a) Policy Failures in Taxation
- Ultra-rich often pay lower effective taxes than middle-class groups.
- Billionaires & centi-millionaires avoid tax through loopholes.
- Governments lose money needed for:
- education
- healthcare
- climate action
- welfare programmes
b) Low Public Investment
- Weak investment in:
- schools
- healthcare
- nutrition
- childcare
? causes lifelong inequality.
c) Weak Social Security
- Cash transfers, pensions, and unemployment benefits are limited.
POSSIBLE SOLUTIONS
1. Progressive Taxation
- Rich pay more, poor pay less. Helps reduce extreme gaps.
2. Strong Public Services Free or affordable:
- schools
- hospitals
- nutrition programmes
- childcare
? reduces early-life inequality.
3. Social Support
- Pensions
- Unemployment benefits
- Direct cash transfers
? helps poorest households.
- Prelims: Key facts, institutions, locations and terminology in the article.
- Mains: Connect the topic with Environment, Polity & Governance, Health.
- Revision: Use the article headings to prepare concise notes and answer-writing points.
Test your understanding
Questions from this article
Prelims practiceWith reference to WORLD INEQUALITY REPORT, consider the following statements:
- The World Inequality Report 2026 has been released.
- It shows that income and wealth inequality in India are among the highest in the world.
- Key finding: Top 10% earn 58% of India’s income; bottom 50% earn only 15%.
Which of the statements given above are correct?
- 1 and 2 only
- 2 and 3 only
- 1 and 3 only
- 1, 2 and 3
View answer
Answer: (d) 1, 2 and 3. All three statements are drawn from the article.
Mains practiceDiscuss the background, key issues and significance of WORLD INEQUALITY REPORT for India.
Answer in 250 words.
View answer approach
- WHY IN NEWS?
- WHAT THE REPORT SAYS ABOUT INDIA?
- GLOBAL TRENDS
- INDIA’S POSITION IN GLOBAL INCOME DISTRIBUTION
- CLIMATE INEQUALITY
Frequently asked questionsFrequently asked questions
Why is World Inequality Report in the news?
The World Inequality Report 2026 has been released. It shows that income and wealth inequality in India are among the highest in the world.
What are the key facts about World Inequality Report?
Key finding: Top 10% earn 58% of India’s income; bottom 50% earn only 15%. Income Inequality Top 10% earners ₹ 58% of national income Bottom 50% ? only 15% Earlier Report 2022: top 10% had 57%, bottom 50% had 13%.
Why is World Inequality Report important for UPSC preparation?
The topic connects current developments with Environment, Polity & Governance, Health and is relevant for both objective revision and analytical answer writing.