UPSC Current Affairs
India's Carbon Credit Trading Scheme : An Assessment
Context The Government of India has announced Greenhouse Gas (GHG) emission intensity targets under the Carbon Credit Trading Scheme (CCTS) for 8 key industrial sectors. Sectors covered: Aluminium, Cement, Paper & Pulp, Chlor-Alkali, Iron & Steel, Textile, Petrochemicals, Petroleum Refineries WHY ASSESSING AMBITION NEEDS A BROADER LENS? Issue with Sector/Entity-Level Analysis Evaluating only individual sectors/entities does not reflect the national emissions reduction What truly matters is the aggregate emissions reduction across the entire economy.
VRAuthor Desk
2 min read
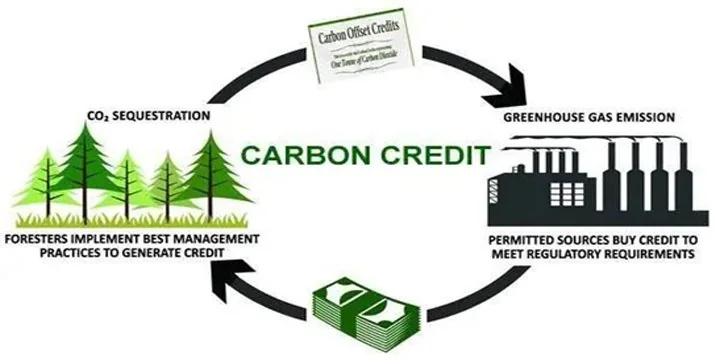
Context The Government of India has announced Greenhouse Gas (GHG) emission intensity targets under the Carbon Credit Trading Scheme (CCTS) for 8 key industrial sectors. Sectors covered: Aluminium, Cement, Paper & Pulp, Chlor-Alkali, Iron & Steel, Textile, Petrochemicals, Petroleum Refineries WHY ASSESSING AMBITION NEEDS A BROADER LENS? Issue with Sector/Entity-Level Analysis Evaluating only individual sectors/entities does not reflect the national emissions reduction What truly matters is the aggregate emissions reduction across the entire economy.
Context
- The Government of India has announced Greenhouse Gas (GHG) emission intensity targets under the Carbon Credit Trading Scheme (CCTS) for 8 key industrial sectors.
- Sectors covered: Aluminium, Cement, Paper & Pulp, Chlor-Alkali, Iron & Steel, Textile, Petrochemicals, Petroleum Refineries
WHY ASSESSING AMBITION NEEDS A BROADER LENS?
Issue with Sector/Entity-Level Analysis
- Evaluating only individual sectors/entities does not reflect the national emissions reduction
- What truly matters is the aggregate emissions reduction across the entire economy.
Learning from the PAT Scheme
- Perform, Achieve and Trade (PAT) is India’s flagship energy efficiency program.
- Entities that exceed their targets can trade energy-saving certificates.
- Example (PAT Cycle I, 2012–2014):
- Sectors analyzed: Aluminium, Cement, Paper, Chlor-Alkali
- Mixed sector-wise performance, but overall energy intensity decreased when data was aggregated.
- Conclusion: Market mechanisms like PAT can drive economy-level efficiency improvements even if individual sector outcomes vary.
Market Principle
- The CCTS is based on an externality-driven market.
- The goal is economy-wide emissions reduction, not uniform sector-level success.
- Entity or sector-level targets mainly facilitate financial transfers, not necessarily emission cuts.
LIMITATIONS OF PAST DATA
Past Performance ? Future Ambition
- Comparing CCTS targets with historical PAT performance is not meaningful.
- Future targets must be more ambitious to meet climate goals.
Relevant Benchmark
- Targets should align with:
- India's Nationally Determined Contributions (NDC) for 2030
- Net-Zero goal for 2070
Role of Economy-Wide Modelling
- Sector-specific targets cannot be directly compared to national targets.
- However, economy-wide modelling helps evaluate whether current targets are adequate.
HOW DO CCTS TARGETS COMPARE TO FUTURE DECARBONISATION NEEDS?
Model Projections (2025–2030)
- Energy sector: Requires a 3.44% annual reduction in emissions intensity per unit of GDP.
- Manufacturing sector: Needs a 2.53% annual reduction in Emissions Intensity of Value Added (EIVA).
Current CCTS Targets
- The average annual EIVA reduction for the 8 CCTS sectors is 1.68% (2023–24 to 2026–27).
- This is below the required pace:
- Manufacturing target: 2.53%
- Energy sector: 3.44%
Caveat
- The CCTS covers only a portion of the manufacturing sector.
- Still, this estimate indicates that current targets are likely not ambitious enough.
- More detailed modelling is needed for a precise assessment.
- Prelims: Key facts, institutions, locations and terminology in the article.
- Mains: Connect the topic with Environment, Economy, Polity & Governance.
- Revision: Use the article headings to prepare concise notes and answer-writing points.
Test your understanding
Questions from this article
Prelims practiceWith reference to India's Carbon Credit Trading Scheme : An Assessment, consider the following statements:
- The Government of India has announced Greenhouse Gas (GHG) emission intensity targets under the Carbon Credit Trading Scheme (CCTS) for 8 key industrial sectors.
- Sectors covered: Aluminium, Cement, Paper & Pulp, Chlor-Alkali, Iron & Steel, Textile, Petrochemicals, Petroleum Refineries
- Evaluating only individual sectors/entities does not reflect the national emissions reduction
Which of the statements given above are correct?
- 1 and 2 only
- 2 and 3 only
- 1 and 3 only
- 1, 2 and 3
View answer
Answer: (d) 1, 2 and 3. All three statements are drawn from the article.
Mains practiceDiscuss the background, key issues and significance of India's Carbon Credit Trading Scheme : An Assessment for India.
Answer in 250 words.
View answer approach
- WHY ASSESSING AMBITION NEEDS A BROADER LENS?
- LIMITATIONS OF PAST DATA
- HOW DO CCTS TARGETS COMPARE TO FUTURE DECARBONISATION NEEDS?
Frequently asked questionsFrequently asked questions
Why is India'S Carbon Credit Trading Scheme : An Assessment in the news?
Context The Government of India has announced Greenhouse Gas (GHG) emission intensity targets under the Carbon Credit Trading Scheme (CCTS) for 8 key industrial sectors. Sectors covered: Aluminium, Cement, Paper & Pulp, Chlor-Alkali, Iron & Steel, Textile, Petrochemicals, Petroleum Refineries WHY ASSESSING AMBITION NEEDS A BROADER LENS?
What are the key facts about India'S Carbon Credit Trading Scheme : An Assessment?
Issue with Sector/Entity-Level Analysis Evaluating only individual sectors/entities does not reflect the national emissions reduction What truly matters is the aggregate emissions reduction across the entire economy. Learning from the PAT Scheme Perform, Achieve and Trade (PAT) is India’s flagship energy efficiency program. Entities that exceed their targets can trade energy-saving certificates.
Why is India'S Carbon Credit Trading Scheme : An Assessment important for UPSC preparation?
The topic connects current developments with Environment, Economy, Polity & Governance and is relevant for both objective revision and analytical answer writing.