Transparency International's Corruption Perceptions Index compares perceived levels of public-sector corruption across countries. The index is useful for understanding governance quality, institutional trust, accountability and the limits of perception-based international rankings.
Why in News?
- Transparency International released the Corruption Perception Index (CPI) 2025.
- It assessed 182 countries on the basis of perceived public sector corruption.
- Score range:
- 0 = Highly Corrupt
- 100 = Very Clean
- The report shows a worrying global decline in corruption control.
WHAT IS CORRUPTION PERCEPTION INDEX?
- Released annually by Transparency International (TI).
- Measures corruption in the public sector.
- Based on expert assessments and opinion surveys.
- It does not measure actual corruption cases. It measures perception of corruption.
KEY HIGHLIGHTS OF CPI 2026
Global Performance - Global average score: 42 (lowest in more than 10 years).
- 122 out of 182 countries scored below 50. ? This shows corruption is a serious global problem.
- Countries scoring above 80 reduced from 12 (10 years ago) to just 5 now.
Top Performers (Very Clean Countries) - Denmark (89) – 1st rank (8th time in a row)
- Finland
- Singapore
- New Zealand
- Norway
Worst Performers (Highly Corrupt) - Somalia (9)
- South Sudan (9)
- Venezuela (10)
Most lowest-ranked countries are conflict-affected or authoritarian regimes.
INDIA’S PERFORMANCE
- India has risen to 91st place out of 182 countries and territories.
- It improved by 5 ranks compared to the previous year (96th).
- Score increased by 1 point, from 38 in 2024 to 39 in 2025.
- This shows a modest improvement in perceived public sector integrity.
Comparison with Neighbours - Bhutan – 71 (Rank 18)
- China – 43 (Rank 76)
- Maldives – 39 (same as India)
- Sri Lanka – 35
- Nepal – 34
- Pakistan – 28
- Bangladesh – 24
- Afghanistan & Myanmar – 16
India performs better than many South Asian countries.But it still needs strong reforms.
DEMOCRACY V/S CORRUPTION The report clearly shows:
- Full Democracies – Average score 71
- Flawed Democracies – 47
- Authoritarian regimes – 32
Conclusion:
Stronger democratic institutions = Less corruption CAUSES OF CORRUPTION (AS PER REPORT)
1. Weak Justice System - Political interference in judicial appointments
- Lack of independence
- Poor funding
- Powerful people escape punishment
When justice system is weak, corruption increases.
2. Undue Political Influence - Opaque political funding
- No regulation of lobbying
- Conflict of interest
- Influence of rich donors
This leads to
grand corruption and
state capture (when institutions serve elites, not people).
3. Shrinking Civic Space - Restrictions on NGOs
- Censorship
- Violence against journalists
Since 2012,
829 journalists killed globally, many were investigating corruption. When media and civil society are weak, corruption increases.
4. Weak Public Financial Management - Poor monitoring of public spending
- Corruption in procurement
- Lack of audit and parliamentary scrutiny
- Patronage networks
Public money gets diverted.
CONSEQUENCES OF CORRUPTION
1. Weak Rule of Law - Victims do not get justice
- Poor and marginalised suffer more
- Creates cycle of injustice
2. Democratic Decline - Elections become unfair
- Parliament becomes weak
- Public trust reduces
- Rise of authoritarian tendencies
3. Poor Public Services - Weak healthcare
- Poor education
- Bad infrastructure
- Unofficial payments act like regressive tax (poor pay more burden)
This increases inequality and poverty.
4. Economic and Social Impact - Reduces investment
- Causes economic instability
- Climate funds get misused
- Leads to protests and political instability
Example: Youth-led protests in Nepal and Madagascar in 2025.
ABOUT TRANSPARENCY INTERNATIONAL
- Founded: 1993
- Headquarters: Berlin, Germany
- Nature: Global civil society organisation
- Mission: Fight corruption worldwide
Important Publications - Corruption Perception Index (CPI)
- Global Corruption Barometer
TI defines corruption as: “Abuse of entrusted power for private gain.”
RECOMMENDATIONS OF CPI 2025
1. Strengthen Justice System - Independent judiciary
- Transparent appointments
- Adequate funding
- Protection for victims
2. Regulate Political Finance - Transparency in donations
- Cap on political funding
- Disclosure of lobbying
- Manage conflict of interest
3. Protect Civic Space - Freedom of expression
- Safety of journalists
- Protection of whistleblowers
- Remove funding restrictions for NGOs
4. Strengthen Financial Oversight - Strong parliamentary scrutiny
- Independent audits
- Transparent procurement
- Public participation in oversight
5. International Cooperation - Stop cross-border money laundering
- Seize stolen asset
- Multilateral cooperation
CONCLUSION CPI 2025 shows serious global concern.The global average fell to 42. Most countries face corruption challenges.Main reasons are weak institutions, shrinking civic space and political capture.To improve, countries must strengthen democracy, protect the media, ensure judicial independence and increase transparency.Strong institutions are the real solution to corruption.
Corruption Perceptions Index (CPI) is a critical benchmark for assessing the perceived levels of public sector corruption across different countries. It is based on surveys conducted among business leaders, experts, and analysts both within and outside the countries in question.
Releasing Authority The CPI is released annually by
Transparency International, an international non-governmental organization
headquartered in Berlin, Germany. The index has been
published every year since 1995. 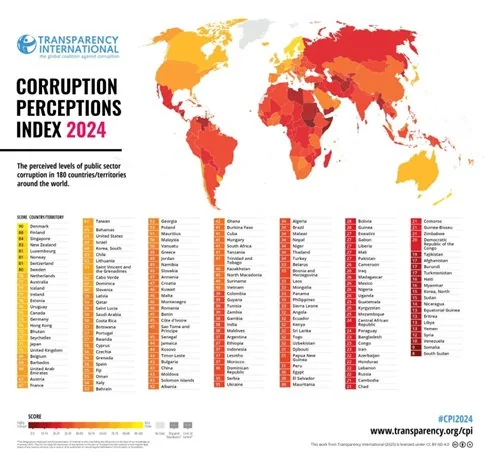
CPI, 2024
- Release Date: February 2025
- Countries Ranked: 180 countries and territories
- Scoring System: Ranges from 0 (highly corrupt) to 100 (very clean)
- Global Average Score: 43 points
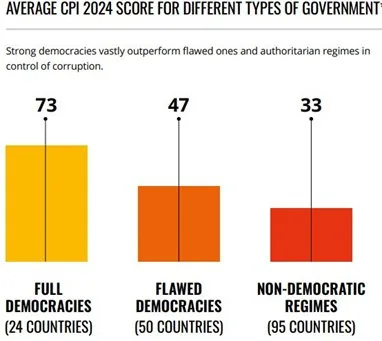
- Democratic Regimes:
- Full democracies: Average score of 73
- Flawed democracies: Average score of 47
- Non-democratic regimes: Average score of 33
KEY FINDINGS
- Global Corruption Levels: Over two-thirds of countries scored below 50, indicating significant corruption issues worldwide.
- Improvements and Stagnation: 32 countries have significantly reduced corruption levels since 2012, while 148 countries have shown stagnation or worsening corruption.
- Perfect Score: No country achieved a perfect score of 100, indicating that complete transparency remains elusive.
REGIONAL INSIGHTS
- Western Europe and the European Union: Leading with an average score of 66, but showing a decline for the second consecutive year due to business interests outweighing public good and weak enforcement of laws.
- Sub-Saharan Africa: Lowest average score at 33, but with signs of improvement in specific countries despite challenges like climate change and conflict.
- Middle East and North Africa: Slight increase in corruption levels, with an average score of 39. Key issues include conflict, authoritarianism, and weak justice systems.
- Eastern Europe and Central Asia: Second-lowest average score globally, exacerbated by conflict, weak institutions, and authoritarian tendencies.
- The Americas: Need for urgent action to address impunity, protect civic spaces, and curb the influence of organized crime in politics.
- Asia Pacific: Mixed progress with improvements in some countries but a declining average score due to worsening corruption cycles and climate change impacts.
Top 5 Countries - Denmark: 90 points (7th year in a row)
- Finland: 88 points
- Singapore: 84 points
- New Zealand: 83 points (outside the top three for the first time since 2012)
- Luxembourg, Norway, Switzerland: 81 points each
Lowest Ranked Countries - South Sudan: 8 points
- Somalia: 9 points
- Venezuela: 10 points
- Syria: 12 points
- Equatorial Guinea, Eritrea, Libya, Yemen: 13 points each
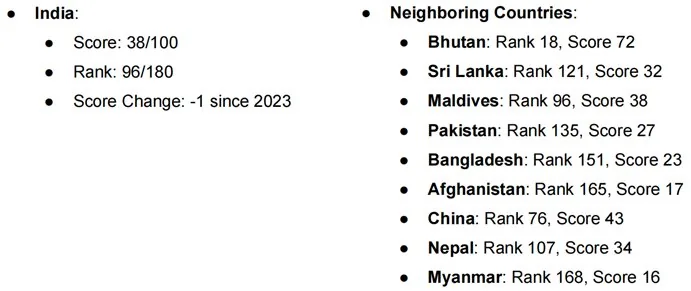
INDIA & ITS NEIGHBOURS
Why This Topic Matters for UPSC
- Prelims: Revise definitions, institutions, locations, reports and factual features connected with Corruption Perceptions Index: India's Rank and Key Findings.
- Mains: Link the topic with Governance, Transparency, International Reports and organise the answer under background, significance, challenges and way forward.
- Interview: Explain the issue in balanced language and distinguish verified facts from opinion.
Key Takeaway
Transparency International's Corruption Perceptions Index compares perceived levels of public-sector corruption across countries. The index is useful for understanding governance quality, institutional trust, accountability and the limits of perception-based international rankings.
Test your understanding
Questions from this article
Prelims practiceWith reference to Corruption Perception Index, consider the following statements:
- Release Date: February 2025
- Countries Ranked: 180 countries and territories
- Scoring System: Ranges from 0 (highly corrupt) to 100 (very clean) Global Average Score: 43 points Democratic Regimes: Full democracies: Average score of 73 Flawed democracies: Average score of 47 Non-democratic regimes…
Which of the statements given above are correct?
- 1 and 2 only
- 2 and 3 only
- 1 and 3 only
- 1, 2 and 3
View answer
Answer: (d) 1, 2 and 3. All three statements are drawn from the article.
Mains practiceDiscuss the background, key issues and significance of Corruption Perception Index for India.
Answer in 250 words.
View answer approach
- CPI, 2024
- KEY FINDINGS
- REGIONAL INSIGHTS
- INDIA & ITS NEIGHBOURS
Frequently asked questionsFrequently asked questions
What is Corruption Perceptions Index?
Transparency International's Corruption Perceptions Index compares perceived levels of public-sector corruption across countries. The index is useful for understanding governance quality, institutional trust, accountability and the limits of perception-based international rankings.
Why is Corruption Perceptions Index important for UPSC?
It connects current developments with Governance, Transparency, International Reports and supports factual revision as well as analytical answer writing.
How should aspirants prepare Corruption Perceptions Index?
Prepare a short definition, key facts, institutional or legal framework, significance, challenges and a balanced way forward. Revise the specific developments and examples explained in the article.